Fantasy Football and Decision-Driven Analytics: A Practical Example
From Data to Insight
�
Earlier in this series, we discussed how insight only exists when meaning is made explicit.
Numbers don’t speak for themselves. Visuals don’t explain themselves. People create meaning.
In business dashboards, we often jump from raw data straight to visuals and assume the insight will land.
Fantasy Football exposes that flaw immediately.
You don’t just want to see player stats. You want to know:
- Who should I transfer in?
- Who should I captain?
- What gives me the highest chance of scoring more points this week?
That’s not an exploration exercise. It’s a decision.
Gameweek 25: One Question

�
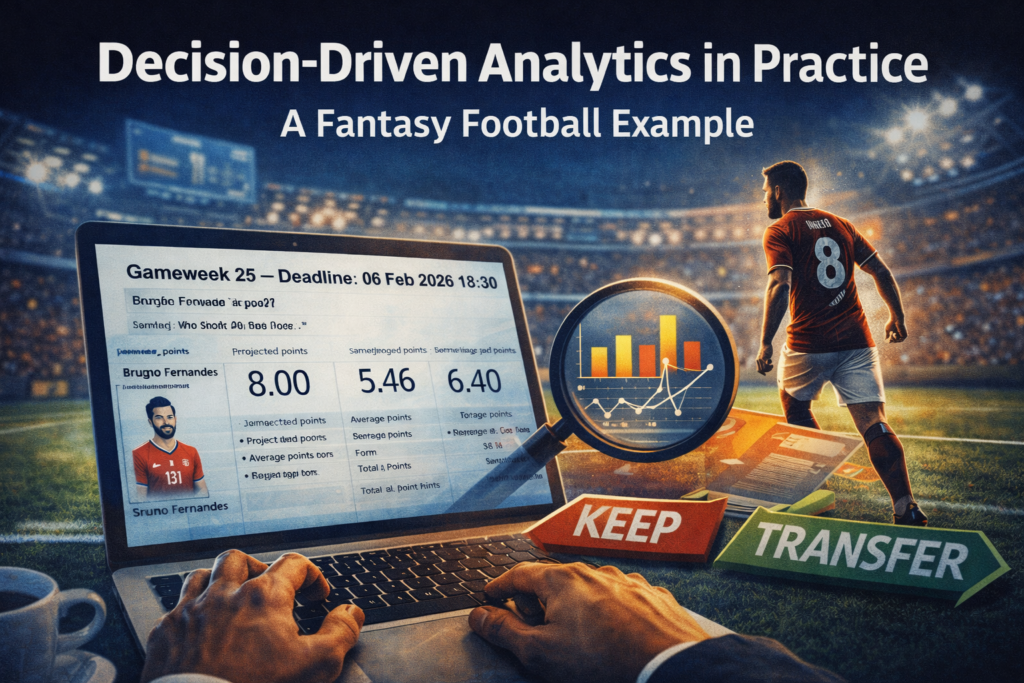
Let’s take this Gameweek 25 example.
The report asks one very simple question:
“What transfer should I make this week?”
Not ten questions.
Not “let’s explore everything.”
Not “let’s see what the data says.”
One decision.
Everything on this page exists to support that single choice.
- Projected points (ep_next)
- Average points
- Form
- Total points
Each metric has a purpose.
They aren’t there because they were available. They’re there because they influence the decision.
What Makes This Different?
This isn’t a neutral dashboard. It has intent.
The layout guides attention. The metrics are prioritised. The context is explicit. The narrative is implied:
- Here’s the player
- Here’s why they matter
- Here’s the evidence
- Here’s why this is the rational move
That’s what data-driven storytelling looks like in practice. It reduces uncertainty. It increases confidence. It makes the choice easier.
Why This Matters Beyond Fantasy Football
This might be a game. But the structure is exactly the same in business. Imagine replacing “Who should I transfer?” with:
- Which supplier should we renegotiate with?
- Which region deserves investment?
- Which product line should we discontinue?
The goal isn’t to show every possible metric. The goal is to design an artefact that helps someone make a decision now. Not next week. Not after three more breakdowns. Now.
Good Analytics Doesn’t Answer Everything
This is the uncomfortable part. Good analytics does not answer every possible question. It answers the right question well.
In this case:
What transfer should I make this week?
That constraint is powerful. It forces discipline. It forces prioritisation. It forces clarity. And that’s exactly what most business dashboards lack.
Decision-Driven Analytics in Practice
This is what I mean when I talk about moving from reporting to decision support.
The report isn’t there to show how clever the model is.
It’s there to reduce cognitive load and increase confidence.
That’s the difference between:
- A dashboard
- A decision tool
Fantasy Football just makes the stakes obvious. If you make the wrong transfer, you lose points. In business, the stakes are higher. But the principle is identical.
The Standard We Should Aim For
We should not be building dashboards that show everything. We should be building artefacts that help someone make a decision.
That means:
- Starting with the question
- Selecting only the signals that matter
- Structuring the page intentionally
- Making the implication obvious
If your dashboard disappeared tomorrow, would a specific decision become harder? If not, it’s reporting. If yes, it’s decision-driven analytics.
Where This Leads
This practical example is exactly how we approach analytics inside the Data Accelerator.
We don’t start with datasets. We start with decisions. And then we design everything backwards from there. Whether it’s Fantasy Football or forecasting revenue, the standard should be the same:
Not more dashboards. Better decisions.
Useful Links
Dashboards Don’t Drive Decisions
Data Overload Is Killing Decision-Making
Why Data Initiatives Stall as Organisations Grow
�
News
Berita Teknologi
Berita Olahraga
Sports news
sports
Motivation
football prediction
technology
Berita Technologi
Berita Terkini
Tempat Wisata
News Flash
Football
Gaming
Game News
Gamers
Jasa Artikel
Jasa Backlink
Agen234
Agen234
Agen234
Resep
Cek Ongkir Cargo
Download Film
Moneyball Fantasy Premier League Power BI: Data-Driven FPL Decisions from My Madrid Talk
Moneyball in Madrid: Data, Decisions, and a Weekend of FPL Analytics
I’ve spent the weekend in Madrid delivering my talk “Moneyball: Building a Killer Fantasy Football Team with Power BI.”It was a brilliant event, and despite my session being in English, the turnout was fantastic. A big thank you to everyone who came along, engaged with the content, and stayed behind afterwards to ask questions. Events like this remind me why I love blending data, football, and teaching.
One question stood out above the rest. Joaquín González Galdo LinkedIn profile asked:
“What is the key metric you use when making decisions in FPL?”
It’s a deceptively simple question, yet powerful. Choosing a single metric to define your decision-making process is something every analyst and FPL manager wrestles with. It deserves a full blog post of its own, and it’s the kind of question I’ll be bringing to the next episode of the Power BI FPL Show with Ben Ferry and Justin Bird. There’s a lot to unpack, from expected points to form trends, fixture difficulty, and effective ownership. Watch this space for a deeper dive.
Power BI File and API Scripts Now Available
During the session, I promised to make my Power BI file available, along with the PowerShell script I used to connect to the FPL API and pull individual player gameweek data. I’ve now uploaded everything to my GitHub hub repo, and you can access it here:
Feel free to explore, clone, modify, and test the model. The Power BI report demonstrates how to build a star-schema model for FPL, how to perform gameweek-level analysis, and how to apply metrics and calculations that help drive decision-making. The PowerShell connector script is lightweight but effective, making it a useful starting point for anyone wanting to extend their own FPL-powered data pipelines.
When Your Internet Fails and You Panic-Transfer Your Keeper
Ironically, just as I was demonstrating the value of data-driven decisions, the venue Wi-Fi failed—leaving me
unable to update my own team live during the talk. Classic.
Once I returned to a stable connection, the first move I made was in goal: Roefs out, Henderson in.
Henderson’s estimated points came in at around 7, compared with Roefs at 2.7, making the swap a straightforward one under my evaluation framework. Even small improvements at the goalkeeper position can meaningfully shift weekly variance, so this one was a no-brainer.
Semenyo vs Grealish – A Tale of Two Underperformers
I’m still torn on whether to transfer out Semenyo. His numbers and projected points definitely suggest that he should go—yet selling him would mean losing team value. Value preservation is a key element of long-term strategy, so for now he survives.
Grealish, however, hasn’t been pulling his weight either, and unlike Semenyo, I’m not emotionally invested in holding him. His form has dipped, and Everton have been erratic.
So I made the switch: Grealish → Harvey Barnes (Newcastle United)
Barnes has been sharp, has strong underlying metrics, and a very favourable run of fixtures. There’s also some interesting off-the-pitch chatter about him potentially switching international allegiance to Scotland following their World Cup qualification, nothing like a burst of motivation to keep his form trending upward.
Woltemade Out – But Who Comes In?
The next move was shipping out Nick Woltemade. West Ham’s Callum Wilson is in form, and although the fixture against Liverpool looks challenging on paper, the FDR simply isn’t capturing how poor Liverpool have been defensively. There’s a part of me that thinks Wilson could genuinely haul. He’s clinical, he’s confident, and he loves a headline moment.
The alternative I’m considering is Igor Thiago from Brentford. He’s less injury-prone than Wilson, he’s been ticking along nicely, and the fixtures are much kinder. His underlying numbers put him firmly in the “viable punt” category. I may still pivot before the deadline.
I chose Thiago.
When Gut Instinct Creeps Back In
One thing I admitted during the session: over the past few weeks, I let my gut start to override my framework. With Manchester City’s tough run of matches, I tried to be clever and avoid captaining Haaland. It hasn’t paid off. This week, the data actually suggested that Harvey Barnes could be a viable captaincy option. His estimated points placed him right in the conversation. But there’s one metric that trumps everything: effective ownership. Haaland’s remains huge. If he hauls—and he’s due—going without him as captain would be catastrophic.
So, despite Barnes being a legitimate option under the model, I’ve done the sensible thing: Haaland is back as captain.Here’s my final lineup
A good reminder that data-driven decision-making is a discipline. It requires consistency.
Final Thoughts
Madrid was superb. Great city, great people, great conversations, and a great reminder of how global the FPL and Power BI communities have become. I’ll be writing more about key metrics, decision frameworks, and how to build your own analytics workflow for Fantasy Premier League.
Until then, enjoy the files, enjoy the data, and good luck for the gameweek ahead.
Useful Links
Exploring Microsoft Fabric Through Fantasy Premier League Data
The Cost of Doing Nothing: How Ignoring Data Strategy Drains SME Growth
How to Win at Fantasy Premier League Using Data Analytics and Power BI
News
Berita Teknologi
Berita Olahraga
Sports news
sports
Motivation
football prediction
technology
Berita Technologi
Berita Terkini
Tempat Wisata
News Flash
Football
Gaming
Game News
Gamers
Jasa Artikel
Jasa Backlink
Agen234
Agen234
Agen234
Resep
Cek Ongkir Cargo
Download Film